2017 GLOBAL BOTNET DDOS ATTACK THREAT REPORT
2017 Global botnet DDoS attack threat report
Antiy Capture Wind Team & Telecom Yundi
1. Overview
The report was jointly released by Antiy Honey net Capture Group and China Telecom DamDDoS. Based on monitoring data by ACS(Antiy Capture System) and Telecom DamDDoS, it mainly focuses on DDoS attack incidents happened in 2017. it describes DDoS both global and regional distribution launched by botnet throughout 2017 and details the attack method, resources and botnet families used by hackers.
According to the overall attack data, 2017 global botnet attack trend presents a “mountain”shape, outbreak mainly in the second quarter; while owing to the most DDoS botnet replaced by miner botnet during the soaring of Bitcoin price, the attack scale in the fourth quarter is relatively low. Global statistics show that in 2017 the number of DDoS attacks launched in America is the largest, accounting for 37.06% of global total attacks; while China suffers the most violent hit, globally 84.79% traffic attack(98.63% in Asia). according to the statistics, DDoS attacks happened in China, 37.47% from America, 27.77% from the domestic, 23.28% from France and 10.17% from South Korea.
Xor(Xor_Ex or Xor_D) botnet is the most frequently used family by DDoS attacks launched by hackers. Hacker controlled DDoS attacks through Xor botnet family make up 51.04% of global attack command. At present, SYN flood is the mainstream DDoS attack method, and used by many large scale botnet families, such as Xor, BillGates and Mayday. In addition, in 2017 IoT botnet appeared to be explosive growth, for Mirai open source caused substantial IoT variants, meanwhile traditional Windows, Linux botnet families are expanding on IoT platform.
2017 botnet main activities:
- Mainstream botnet-Linux
Linux server has the features of large bandwidth, long time online, outdated security protection, stability as well as large scale.
- Rapid development of IoT botnet
the open sourced Mirai accelerated IoT botnet’s development, and as the traditional Windows platform family botnet realizing the power of IoT scale and attack, transferring to IoT platform swiftly, for instance the typical Jenki and Typhoon family.
- Profit-oriented trend
With the rapid development of electronic cryptocurrency, for example Bitcoin in 2017, frequently used botnet transferred from DDoS to miner, which led Linux, IoT botnet becoming the mainstream method of DDoS attack and mining.
The victims of DDoS mainly distributed in China and America. As the rapid development of China’s internet over the years, it has sped up the data center and cloud service as well as great demand towards network service, which also triggered frequent ransom and peer attacks.
2. Attack Command Data
According to captured DDoS attack intelligence in 2017, global and domestic DDoS attack intelligence as below:
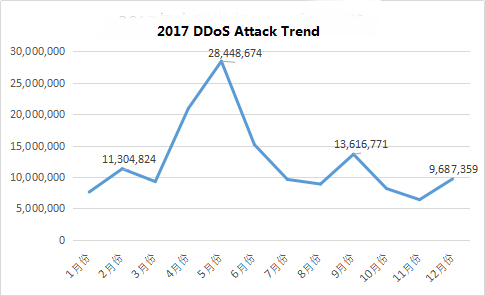
Figure 1: Global DDoS attack trend
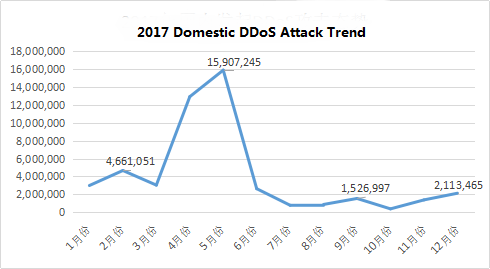
Figure 2: Domestic DDoS attack trend
2.1 Global Attack Data Distribution
According to statistical analysis, 2017 global launched DDoS distribution as follows. Among them, the number of DDoS attacks launched in America is over 58 million, made up 37.06% total DDoS attack of global; China and France separately accounted for 34.00% and 19.0.%.
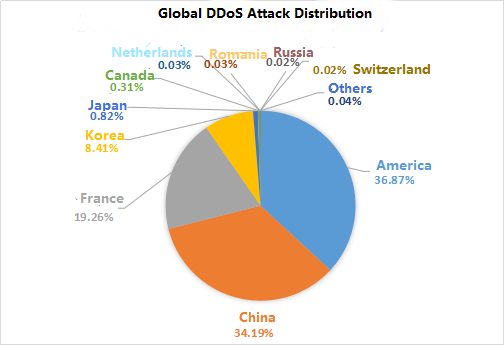
Figure 3: global DDoS attack distribution
2.2 Domestic Attack Data Distribution
After analyzing DDoS attacks happened in different areas of China, attack distribution of different provinces as follows: among them, Jiang xi province had the largest scale of DDoS attack, more than 16 million, topping the others in 30.40%; DDoS attack happened in Hong Kong Special Administrative Region was more than 13 million, ranking the second place as 26.07%; while DDoS happened in Guang dong province was more than 12 million, ranking in the third place as 23.12%.
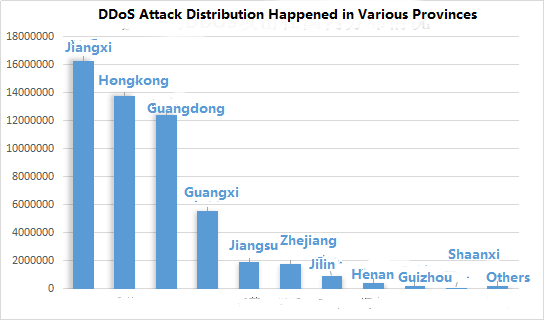
Figure 4: DDoS attack distribution happened in various provinces
3. Attack Traffic Information
Statistics on the total attacks traffic by International, interoperability and Telecom from January to December 2017 have shown that the TB traffic initiated by both International and Interoperability has stabilized at about 10,000, while the Telecom traffic has been increasing since the first half of the year. And In May, there was a peak at 56397.336, and the traffic in the second half of the year started to decline and stabilized. The attack traffic data coincided with the “mountain” shape of the attack command data.
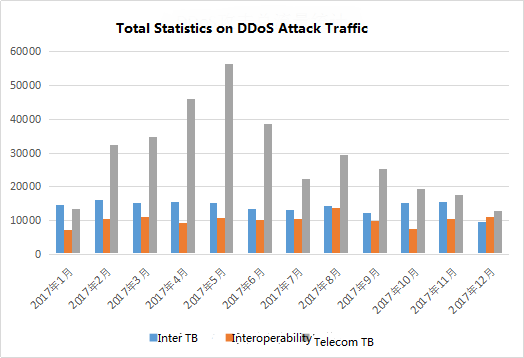
Figure 5: total statistics on DDoS attack traffic
According to data statistics, DDoS attacks in 2017 have a duration of less than 30 minutes, accounting for about 70% of the attack traffic each month.
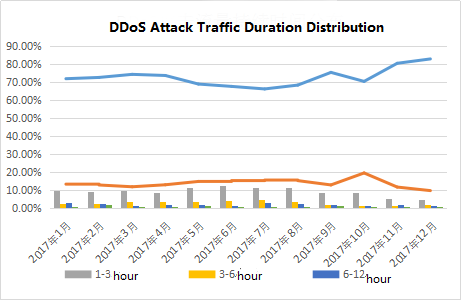
Figure 6: DDoS attack traffic duration distribution
In the 12-month period, the top three traffic averages of single attack targets were DDoS attacks in May, March and April respectively. In May, the maximum attack peak attack was 1393.66 Gbps. The maximum attack target attack in March The peak was 953.78 Gbps, with a maximum attack target attack peak of 798.00 Gbps in April. Fractional attack peak in the proportion of each month as shown below, the attack peak is generally concentrated within 50G, mostly for ordinary hacker attacks.
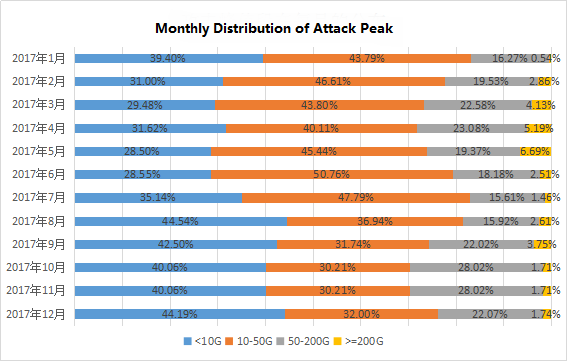
Figure 7: monthly distribution of attack peak
The top ten provinces that attack traffic monthly percentage in the total attacks traffic as follows. Data shows that in 12 months, Zhejiang Telecom’s attack traffic accounted for a large proportion of attacks each month, Fujian Telecom and Hubei Telecom in the second half of the attack traffic has improved significantly.
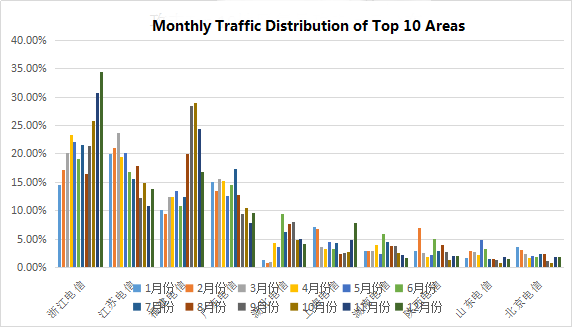
Figure 8: monthly traffic distribution of top 10 areas
4. Attacker’s Information
4.1 Attack Resources
4.1.1 C2 distribution
After tracing the DDoS attacks captured in 2017 and analyzing the obtained C2 information , we find that the C2 distributions that launch DDoS attacks global distribution as follows. Among them, C2 is the largest in China, accounting for 58.36% of the global C2; followed by the United States, accounting for 24.98% of the global C2; the third is South Korea; the C2 in Korea is 1039, accounting for C2 4.11% of the distribution.
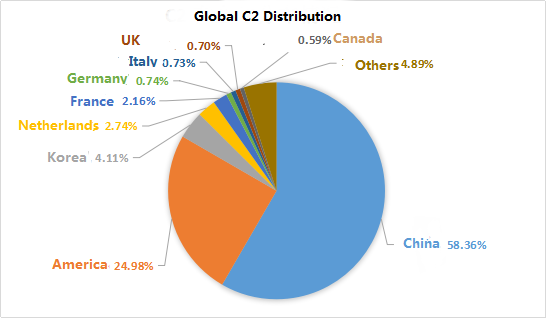
Figure 9: global C2 distribution
Tracing statistics for each C2 attack target, and dividing C2 countries, it comes to the following statistics in sequence , the top three are France (729,343) The United States (230,916), China (65,840).
The C2 of the attack target TOP100 is divided by country, with 71 C2 located in France, 27 C2 located in the United States and the other 2 C2 located in South Korea and Switzerland respectively. The most targeted C2 was from France, and the C2 survival time was 7494.9 Hour, the target of attack reached 19,172.
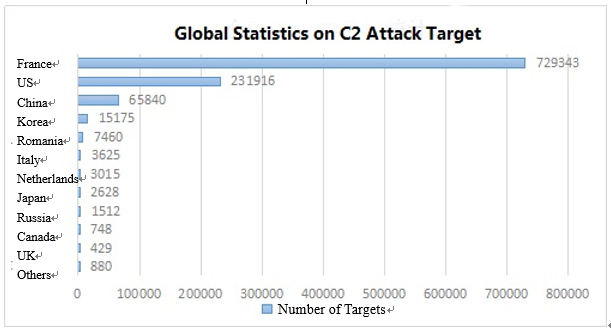
Figure 10: global statistics on C2 attack target
According to the statistics of C2 in China, we can draw the following C2 distribution in each province. Among them, C2 is the largest in Jiangsu province with 3420, accounting for 23.20% of the total domestic C2, followed by C2 located in Hong Kong with 2632 17.85% of the total number of C2.
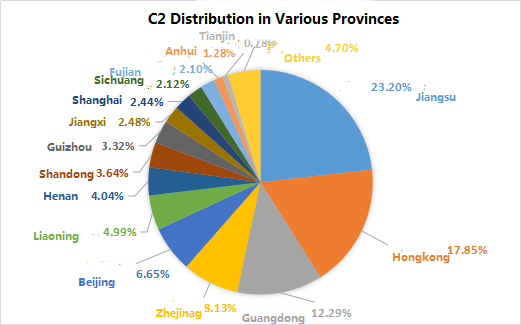
Figure 11: C2 distribution in various provinces
To conduct a traceability analysis of C2 in China and draw C2 statistics by province, the provinces with the top three target numbers of attacks from high to low were Hong Kong (19,987) Guangdong (80,665), Jiangxi (107,050).
There are 31 C2 in Hong Kong, 19 C2 in Guangdong, 14 C2 in Jiangsu, 7 C2 in Zhejiang, 6 C2 in Fujian and 6 C2 in Jiangxi. One C2 that generated the most attacks was in Hong Kong, generating 6162 attacks and 508.05 hours of C2.
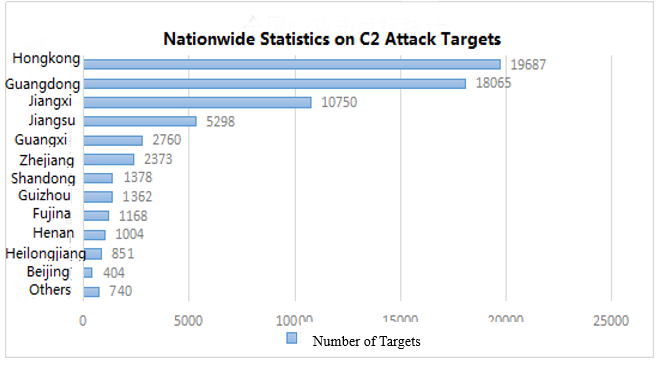
Figure 12: nationwide statistics on C2 attack targets
4.1.2 C2 survival time
Domestic C2 survival time of 40% within 1000 hours, more than 6000 hours of nearly 20%, 80% of the survival time of foreign C2 in 1000 hours, more than 1000 hours only 20%. The number of domestic C2 survival time of more than 1000 hours is three times as much as foreign.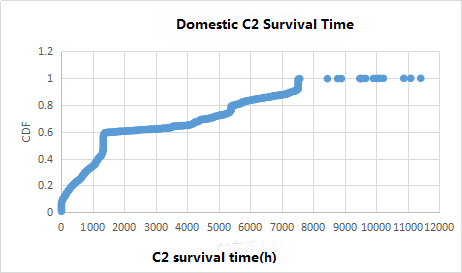
Figure 13: domestic C2 survival time
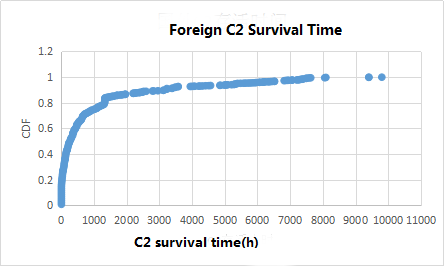
Figure 14: foreign C2 survival time
4.2 Hacker’s Attack tool
4.2.1 distribution
No matter what type of botnet, “bot” is the basis of various attacks, so bot expansion is the first step for hackers. The common bot expansion methods include the following:
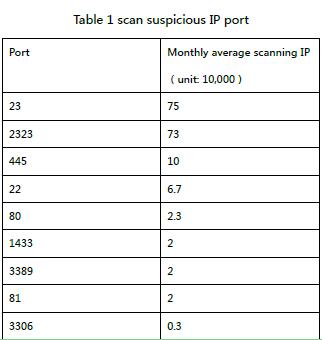
- Weak password brute force. Execute remote commands to implant Trojans through automated weak password brute force of related (eg, 22,222,2,23,2323,1433,3306,3389) service ports. According to the catching honey net brute force statistics, every day the above port burst volume has 3000000-5000000, and each time a new wave of IoT botnet burst, the brute force data will be a geometric increase, especially in foreign countries Related IoT types Botnets are more common.
Vulnerability scanning.
- By automating exploits, implementing remote commands to expand “bots” is a new trend, especially with the Mirai family of botnets.
- A SOAP vulnerability that led to a German network outage by hackers, trying to remotely execute malicious commands in vulnerable devices by performing an injected attack on Network Time Protocol, NTP, server name fields. Eventually, the NTP server name will be resolved as the command that caused the RCE vulnerability. Malicious code can be inserted into the NTP server name field via the TR-069 protocol. Internet service providers (ISPs) can use this protocol to remotely manage devices in the network. Attacked devices can receive TR-064 commands from the Internet, which in turn change the NTP settings. TR-064 is based on HTTP and SOAP and its default port is TCP 7547.
- GoAhead, Embedthis’ Web server, broke the CVE-2017-17562 Remote Code Execution Vulnerability. When used in conjunction with the glibc dynamic linker, remote code execution can be implemented using special parameter names such as LD_PRELOAD. An attacker could post a valid payload of his shared object in the body of the request and reference it with / proc / self / fd / 0. GoAhead is an open source (commercial license), simple, lightweight, powerful embedded Web server that runs on multiple platforms. GoAhead Web Server is a web server tailored for embedded real-time operating system (RTOS). Support a variety of operating systems, including eCos, Linux, LynxOS, QNX, VxWorks, WinCE, pSOS and so on.
Netcore backdoor use is the backdoor exploit that broke out in 2014 and is still present in the captured attack data.
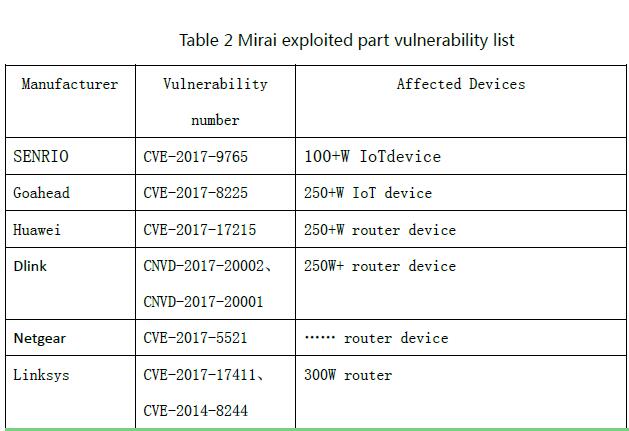
For example, CheckPoint disclosed that IoTroop maliciously exploits multiple vulnerabilities to compromise Zyxel (including routers), Dlink, Netgear, Linksys, Goahead, JAWS, AVTECH, Vacron (NVR) Device Vulnerability. The following table is part of Mirai variant exploits the vulnerability information.
- Bundle download hidden back door. By activating the tool of bundle Trojans, Weasel DDoS Trojan is the use of pony activation tools bundled for large-scale dissemination. In many informal application sites, many “green” applets are hacked by Trojans, and Trojan horses continually infect devices to expand “bots” as applets proliferation. Bundled mode of transmission, because the identity of the “green vest” can effectively avoid the killing of antivirus software, so the formation of botnets through this mode of communication, after time accumulation will often form a huge “bot” group.
- Cross-infection. Spread new Trojans through existing botnets to enable cross-propagation of different botnets. Because this approach enables the rapid deployment of a botnet, it appears particularly frequently in common DDoS botnets.
4.2.2 Botnet Control
A statistical analysis of the samples captured in 2017 showed that the largest sample of captured Gafgyt botnet families was 26,083, followed by Nitol and captured 10,667 samples.
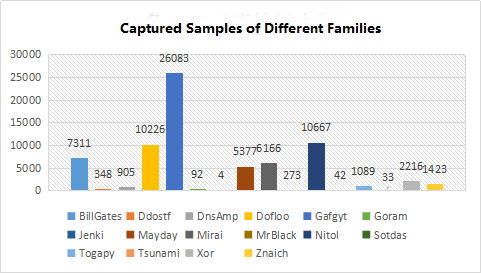
Figure 15: captured samples of different families
The world’s DDoS attacks and hacker-controlled botnet family for statistical analysis, in which the hacker’s most commonly used botnet family Xor_Ex family, hackers use Xor_Ex family launched DDoS attacks up to 55 million times, accounting for 34.92%. Followed by the BillGates family. Hackers useing the BillGates family to launch more than 34 million DDoS attacks, accounting for 21.87% of all the families in use. The third-ranked family is the Mayday family, 19.44% of all families.
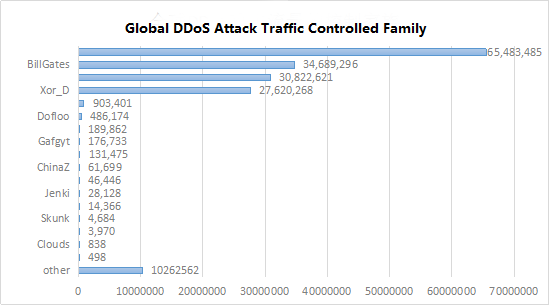
Figure 16: global DDoS attack traffic controlled family
The statistical analysis of the attack behavior of the top seven botnet families accounting for the proportion of DDoS attacks in the whole country shows the distribution of attack modes used by the following botnet families.
- Xor family
The Xor family is the most active DDoS botnet family in the country and even in the world in recent two years. According to the information currently available, hackers operating the Xor family botnet to hide identities from the second half of 2016, and most of the botnet control nodes are gradually transferred to other countries. The devices corresponding to the control nodes basically obtain remote control through illegal channels for deployments permissions have greatly increased the difficulty of tracing hackers.
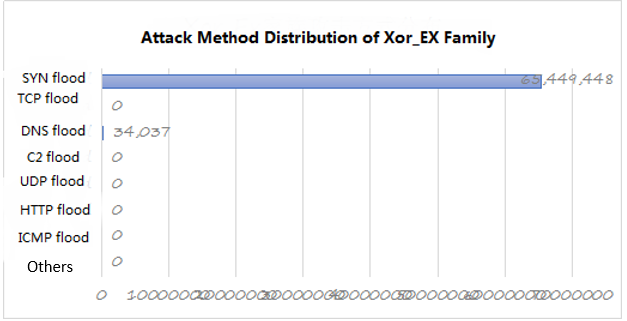
Figure 17: attack method distribution of Xor_EX family
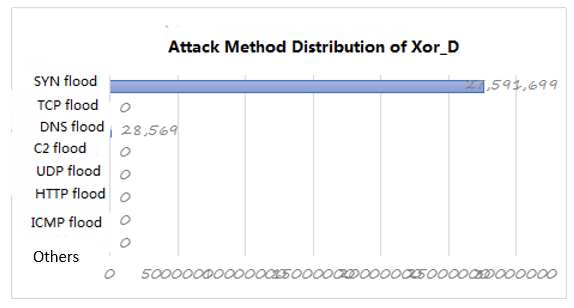
Figure 18: attack method distribution of Xor_D
- BillGates family
BillGates, also known as Setag / Ganiw, is second only to the Xor family. From the intelligence data show that the BillGates family active mainly in the first half, and the type of attack is mainly SYN flood; mid-July, with the virtual currency trading prices rose sharply, most of the BillGates family of botnets began to switch to miner Botnet.
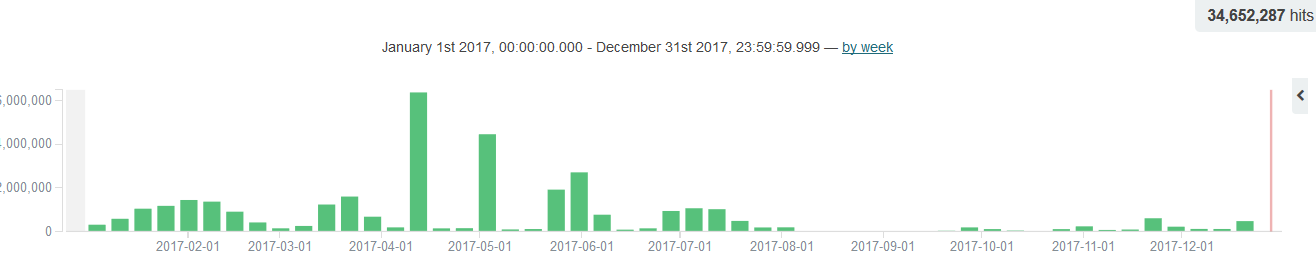
Figure 19: BillGates annual attack intelligence distribution
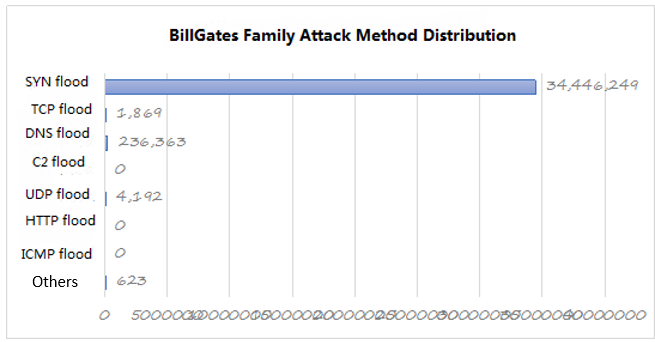
Figure 20: BillGates family attack method distribution
- Mayday family
Mayday family attack intelligence trends similar to the BillGates family, but compared to the BillGates family, earlier silence, and activity was significantly lower than the BillGates family. Mayday family’s main attack type is still SYN flood, followed by TCP flood, other with reflection-based attack mode is rare.
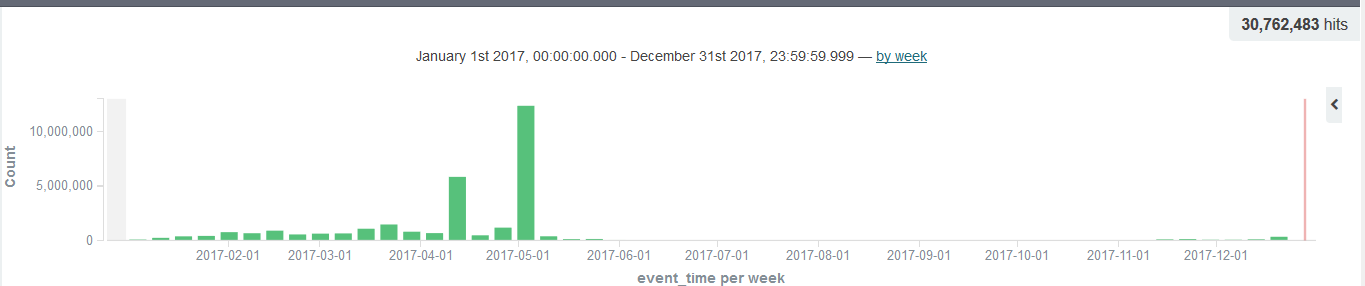
Figure 21: Mayday annual attack intelligence distribution
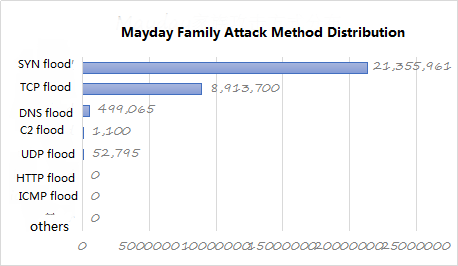
Figure 22: Mayday family attack method distribution
- Nitol family
Nitol family is currently the most active DDoS botnet in Windows series, and after years of development and variation, there are more than 10 different protocol variants, and foreign hackers through the Nitol family open source code upgrade to modify and use. Although the Nitol family of botnet tools have spread abroad, but its main infection equipment is still in the country, especially the NSA’s “Eternal Blue” and Struct2 series of vulnerabilities bursting, which began to appear through the automated vulnerability exploit batch Implanted in each family malicious code (Nitol family included). In terms of DDoS attacks, the latest version of Nitol integrates eight types of attacks, SYN flood, TCP flood, DNS flood, C2 flood, UDP flood, HTTP flood, ICMP flood, and NTP flood. From the attack threat intelligence of the 2017 Nitol family series, the main attack is still on HTTP flood and C2 flood, which is obviously different from other families.
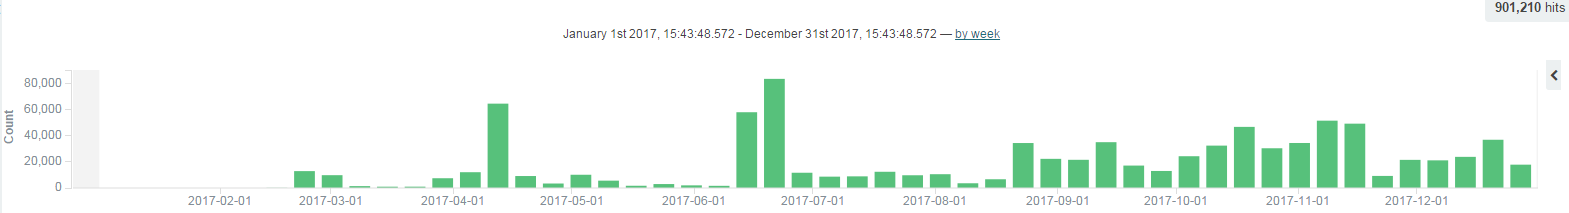
Figure 23: Nitol annual threat intelligence distribution
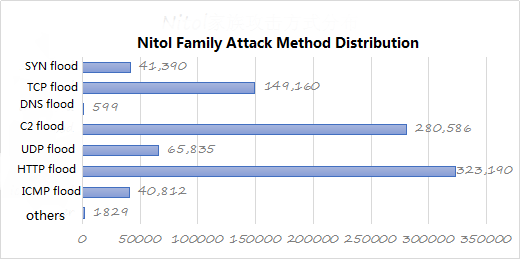
Figure 24: Nitol family attack method distribution
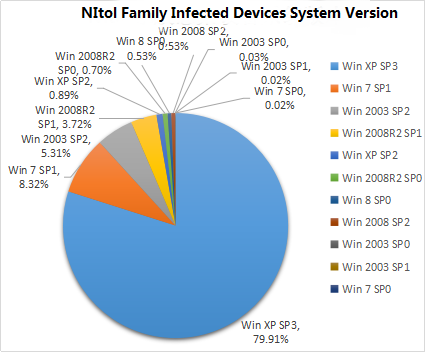
Figure 25: NItol family infected devices system version
According to the botnet monitoring and development of the Nitol family, many botnets that control the Nitol family also control other RAT-type botnets. Mutations and sharing between bots are achieved through cross-infection among multiple botnets. From the “bot” device type, the system versions of the devices infected with the Nitol family are mainly low and mid-range system versions of the Windows series, mainly concentrating on the Win XP SP3 system version (about 80%), followed by Win 7 SP1 System version (about 8.27%). At present, Win XP SP3 main user clusters in the office environment and corporate industrial environment and other neglect of system upgrades and maintenance of terminal equipment. It also shows that Nitol family series of infected equipment systems are mainly common configuration of office equipment or the Internet system Industrial Control Equipment System. Preliminary Statistics indicate about 2.6 million Windows environment devices infected with the Nitol family malicious code every day.
- Dofloo family
No matter from the data encryption algorithm or attack mode or Trojan platform compatibility, Dofloo family are considered a more mature family. Dofloo family uses a 256-bit AES encryption algorithm to encrypt attack data, which can effectively ensure data communication security. In addition to the common SYN floods, TCP floods, and HTTP floods, the Dofloo family also features high-magnification DNS flood, NTP flood, and ICMP flood reflection attacks. Compatible platforms, the Trojans not only compatible with common Windows, Linux and other two types of platforms, while compatible with ARM, IMPS, SIMPLE and other IoT system architecture. Therefore, the compatibility of the platform for the Dofloo family botnet “bot” base amplification a lot; At the same time, it was also found that hackers through CVE-2017-8225 and other automated use of tools to achieve IP network segment more than 200 Vulnerable devices by “batch capture”. The huge “bot flocks” plus high magnification attacks made the Dofloo family far less devastating than other family botnets.
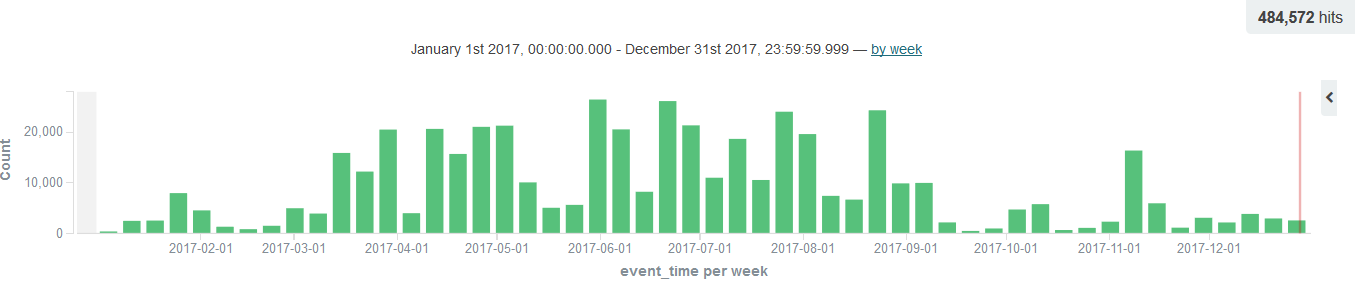
Figure 26: Dofloo annual threat intelligence distribution
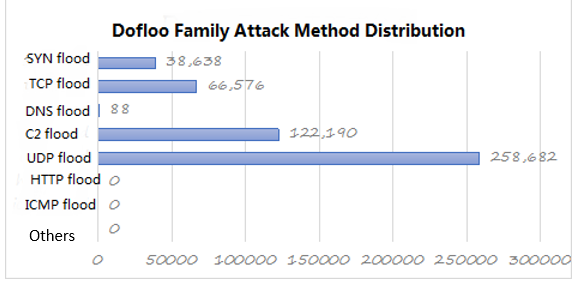
Figure 27: Dofloo family attack method distribution
- Mirai family
Developed and operated by Paras Jha (21), Josiah White (20) and Dalton Norman (21) in the United States in the first half of 2016, the Mirai family is said to have been named the domain name provider Dyn by October 24, 2016 DDoS attacks and other events is what they do. At the same time, in order to hide themselves and to avoid being pursued by law enforcement authorities, they decided to publish the source code on github as someone else prior to the attack, causing the Mirai source code to quickly spread to hackers around the world, triggering the high frequency of the Mirai family variant.
History is always striking similarity, for instance gray pigeons Trojan open source led to the proliferation of delphi Trojan, Gh0st Trojan open source led to the development of VC remote control variants occupying half of the country’s Trojans. Mirai open source also caused domestic black market gang upgrade IoT botnet type.
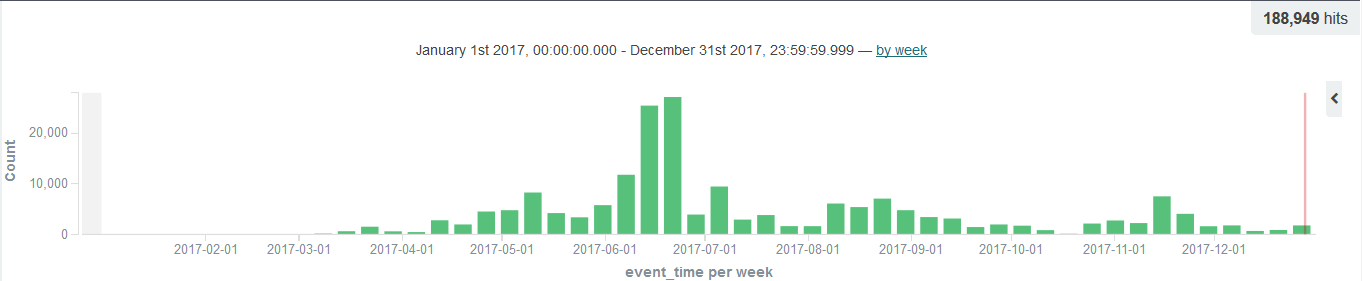
Figure 28: Mirai annual threat intelligence distribution
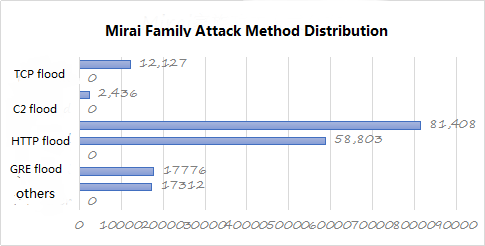
Figure 29: Mirai family attack method distribution
Because Mirai’s Trojan has 22,23 port weak password brute force, adn a variety of Internet of Things device exploits, so that every appearance of Mirai variants, its “bot” volume will be an explosive growth. Preliminary statistics show that the Mirai family only has 7547, 5555, 5676, 37215 and 52869 vulnerability scanning ports involved in more than one year. The involved IoT device vendors include Dahua, Huawei, D-Link, WIFICAM, Linksys, Avtech, Netgear, Vacron, TP-Link and others. From the attack situation of the Mirai family in 2017, the attack situation was relatively active during April-September. Although the Mirai family variant was more frequent in the second half of the year, it did not improve the attack situation.
4.3 Attack Method
At present, hackers initiate DDoS attacks mainly in the following ways: SYN flood, TCP flood, DNS flood, C2 flood, UDP flood, HTTP flood, ICMP flood. The above seven attacks cover 99.97% of all attacks. The following shows the distribution of the above seven attacks in the 12 months of 2017.
Overall, hacker-controlled botnet-initiated DDoS attacks were more active in the first half of the year, accounting for 71.96% of the annual DDoS attacks. In the second half of the year, however, the trend of active DDoS attacks gradually weakened, and the upward trend continued in December. SYN flood attack has always been a hacker attack DDoS attack more popular way, all attacks in the year SYN flood attack accounted for the largest proportion of 91.56%, of which, in April and May was particularly active In May, the number of attacks launched with the SYN flood attack reached 15.86 million.
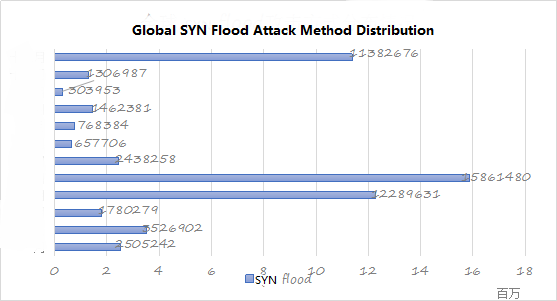
Figure 30: global SYN flood attack method distribution
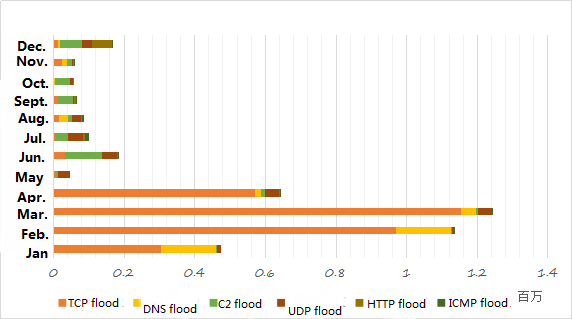
Figure 31: global TCP, DNS, C2, UDP, HTTP, ICMP flood attack method distribution
5 Attack Information
5.1 worldwide statistical attack
According to statistics, 130 countries were attacked by hacker DDoS in 2017, mainly in Asia, accounting for 85.97% of the total, followed by North America, accounting for 10.77% of the total; Europe accounting for 2.99%; other continents Although the proportion is low, but there are captured attack data. Among them, China has become a hardest hit by DDoS attacks. The total number of attacks has reached more than 122 million, accounting for 84.79% of the total number of attacks in the world and accounting for 98.63% of the total attacks in Asia.
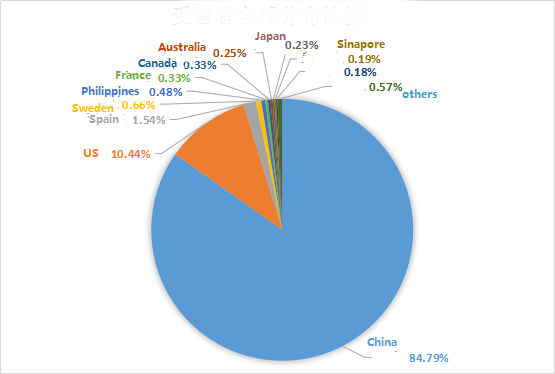
Figure 32: global victim distribution
5.2 Nationwide Statistics for Attacked Areas
According to the statistical analysis, the distribution of domestic victims of DDoS attacks in 2017 is as follows. Among them, Zhejiang Province is the hardest hit area in China, with more than 37.9 million attacks, accounting for 31.39% of the total DDoS attacks nationwide. Shandong Province ranked second, being attacked more than 2920 million, accounting for 24.21% of the total number of DDoS attacks nationwide.
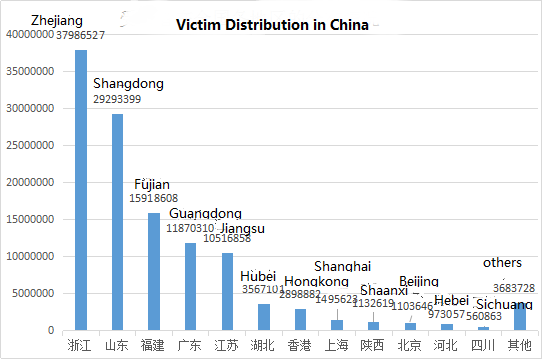
Figure 33: victim distribution in China
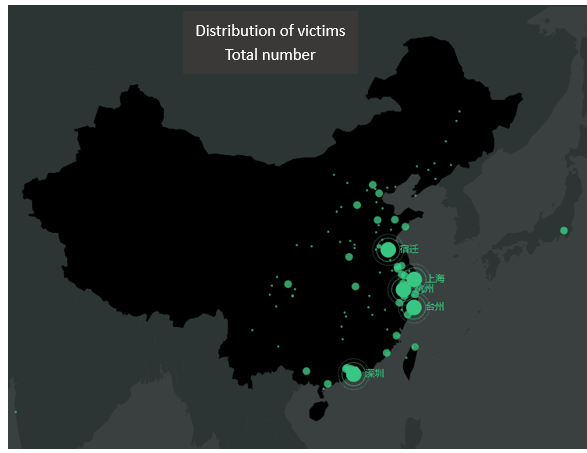
Figure 34: nationwide DDoS attack trends on Dec 29, 2017
5.3 DDoS Attack Actor Country
The statistical analysis of DDoS attacks in China in 2017 shows that the control nodes in the United States have launched more than 46 million DDoS attacks in China and all the DDoS attacks suffered in China Accounting for 37.47% of the total; secondly, domestic control nodes initiated DDoS attacks in all parts of the country accounting for 27.77% of the total; the control nodes in France attacked China’s domestic operations, accounting for 23.28% of the total; Control nodes in Korea accounted for 10.17% of the attacks in our country.
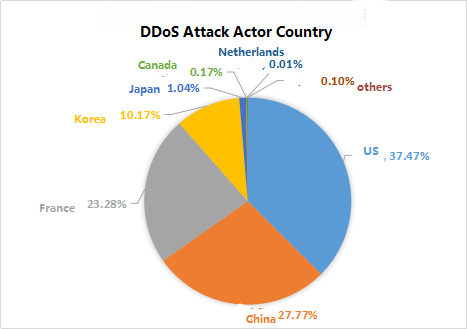
Figure 35: DDoS attack actor country
5.4 Industry types under attack
According to incomplete statistics, hackers launched the DDoS attacks, the distribution of the victim industry are as follows: the chess industry accounted for the highest, 45.2%, the game industry accounted for 22.8%, school research accounted for 11.5%, the financial sector accounted for 8.5%, accounting for administrative units Than 5.5%, other industries accounted for 6.5%.
Malicious competition between businesses or malicious blackmail extortion is the root cause of various industries suffered DDoS attacks, the game industry is particularly affected by the impact of DDoS attacks, the game company’s daily loss of up to millions of dollars.
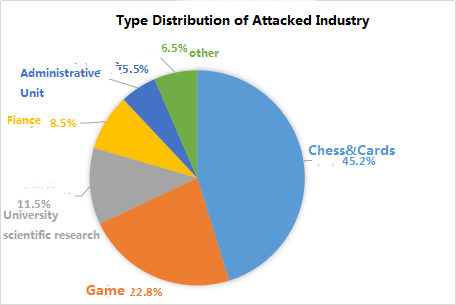
Figure 36: type distribution of attacked industry
6.Bot Intelligence
6.1 Bot Equipment Types
Device types were analyzed using captured bots, with Windows, Linux, and IoT devices as the category, with the bots with the highest IoT device types accounting for 61.37%, followed by Linux device bots with 20.85%, and Windows devices with bots Only accounted for 17.78%.
IoT devices are the type of bot that hackers like to breach because of their loopholes, longer bug fixes, and ease of intrusions and controls. Among the IoT vendors involved in the statistics are Huawei, ZTE, H3C and Dahua. Among them, 442 bot devices are Huawei IoT devices, 240 belong to ZTE’s IoT devices and 1,142 belong to H3C’s IoT devices.
bots for Linux devices are mostly weak password brute force through ports 22 and 23 for bot control. The type of bot Windows devices, mostly hackers through the use of “Eternal Blue” loopholes in the various combinations of viruses, Trojans, in order to achieve the capture of bots.
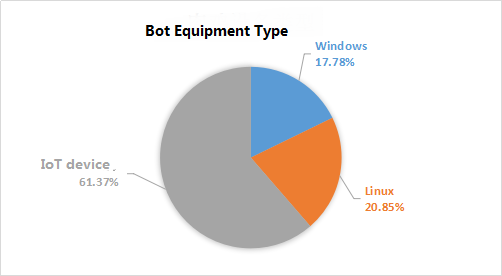
Figure 37: bot equipment type
6.2 distribution area
Of the 33661 bot IPs obtained, analysis and localization found that 33,555 bot IPs were located in China. Based on the pooled analysis of the IP location of domestic bots, the distribution of some bot chickens in domestic provinces was obtained. There were 5,961 bots and 5,899 bot chickens in Zhejiang and Jiangsu provinces respectively. From the geographical point of view, bot IP mostly in coastal cities, China’s coastal cities from north to south were Shandong Province, Jiangsu Province, Zhejiang Province, Fujian Province, Guangdong Province, the number of bots in these five provinces are ranked in the top ten.
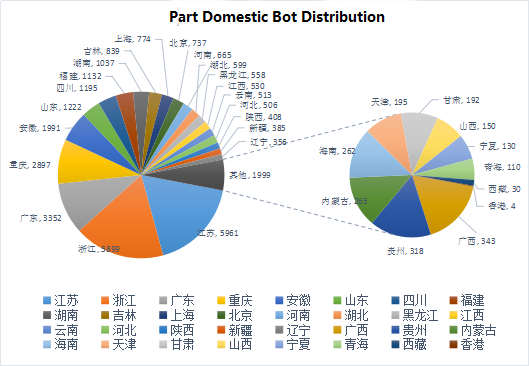
Figure 38: part domestic bot distribution
7. Conclusion
Starting with the first real DDoS attack in 1998, traffic was gradually expanded from 10GB to 90GB to 300GB, 400GB, and 800GB, and now it has been calculated at “T” level. DDoS attacks have been growing at almost the leap forward. Affected devices, from the very beginning of a single server, a regional number of servers, to the entire service for an industry, and even almost paralyzed the European network; the impact range from personal, small-scale network, the development of commercial Competition among nations, state financial services and even political, military operations among nations.
From the history of DDoS attacks, we can easily see that in today’s virtual network has been embedded in our real life society. DDoS attacks are undoubtedly a huge security risk. Along with the cheapness and accessibility of DDoS tools and the rapid growth of various botnet families, the use of IoT devices to build botnets is increasingly challenging. At the same time, mobile botnets are in their infancy, and The road of network security still has a long way to go.
8. Reference
[1]Trojan.weasel DDoS incident report by Antiy.
http://www.antiy.com/response/weasel.html 201708
[2]botnet group exploits Mirai open source code to upgrade attack equipment
http://www.freebuf.com/articles/web/153689.html 2017
[3]http://www.freebuf.com/articles/web/153689.html 2017